Visualization
November 13, 2009
Stacey Mason
Stacey Mason
Christian Swinehart reintroduces us to the old Choose-Your-Own-Adventure books that we know and love, and uses a beautiful new visualization to do it.
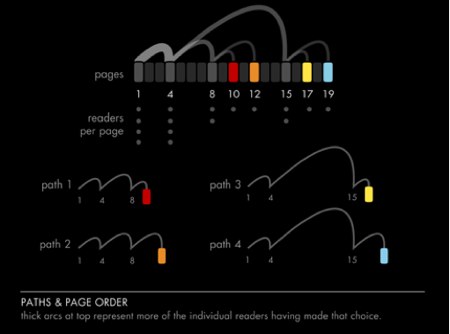
Swinehart color codes pages of different types: red for catastrophic endings, orange for disappointments lighter orange for mediocre outcomes, yellow for favorable results, and blue for great or “winning” endings; grey pages represent branching decisions or choiceless story pages. He then uses this color system to map readers’ choices through the story. The new visualization for traversing choices is fascinating, and emphasizes the elevated level of author control available through computer constraints versus the constrains of the codex; the codex author may not want you to look ahead to page 83, but she can’t really stop you.
This constraint is most apparent in the gallery, where the site offers readers a chance to read the old adventures, restricting them to the choices presented in the text. The reader can track her own progress on a thumbnail map. The presentation of the pages, particularly scrolling over darkened pages when the reader makes a choice, adds an interesting new dimension to these texts. Not showing any text at all on these pages emphasizes the fact that we are completely “missing” those pages, emphasizing Terry Harpold’s old hypertext dictum that we understand links not only for what they lead us to, but also for those things from which they turn away.